

Matplotlib Tutorial in Python
Chapter 2 | Extracting Data from CSVs and plotting Bar Charts
In the last chapter, we learned to draw simple plots in Matplotlib and further customizing it.In this chapter we will be learning to extract data from external sources like CSV and creating Matplotlib bar charts.
Matplotlib Tutorials in Python - Creating Simple Bar Charts
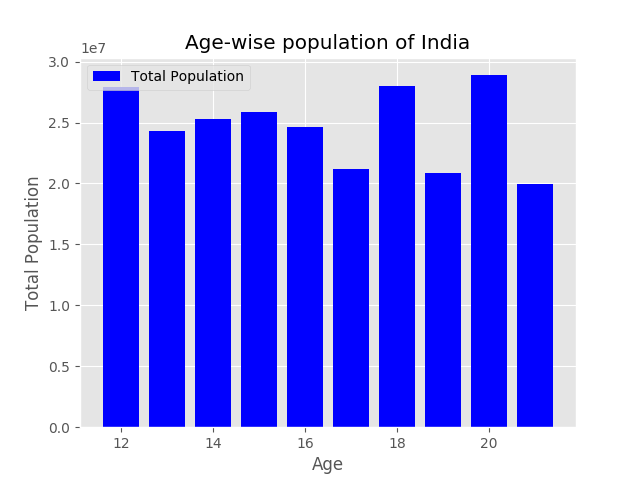
Just like plt.plot() , you can simply use plt.bar() to create Matplotlib Bar Chart.
# matplotlib_barchart_tutorial.py

import matplotlib.pyplot as plt
plt.style.use('ggplot')

ages = [12, 13, 14, 15, 16, 17, 18, 19, 20, 21]

total_population = [27877307, 24280683, 25258169, 25899454, 24592293, 21217467, 27958147, 20859088, 28882735, 19978972]

plt.bar(ages, total_population, color='b', label="Total Population")
plt.legend()
plt.xlabel("Age")
plt.ylabel("Total Population")
plt.title("Age-wise population of India")
plt.show()
Just like plt.plot(), we can pass the color argument to the plt.bar() also.
Matplotlib Tutorials in Python - Adding Line Plots to Bar Charts
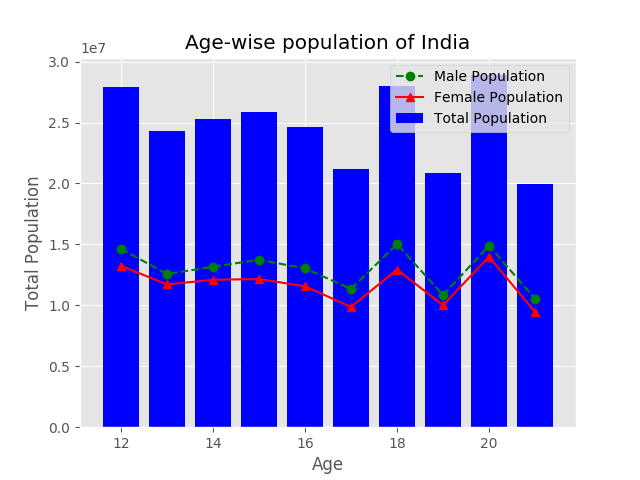
We can add line plots to overlap Matplotlib Bar Charts.
# matplotlib_barchart_tutorial.py

male_population = [14637892, 12563775, 13165128, 13739746, 13027935, 11349449, 15020851, 10844415, 14892165, 10532278]

female_population = [13239415, 11716908, 12093041, 12159708, 11564358, 9868018, 12937296, 10014673, 13990570, 9446694]

plt.plot(ages, male_population, color='g', linestyle='--', marker='o', label="Male Population")
plt.plot(ages, female_population, color='r', linestyle='-', marker='^', label="Female Population")
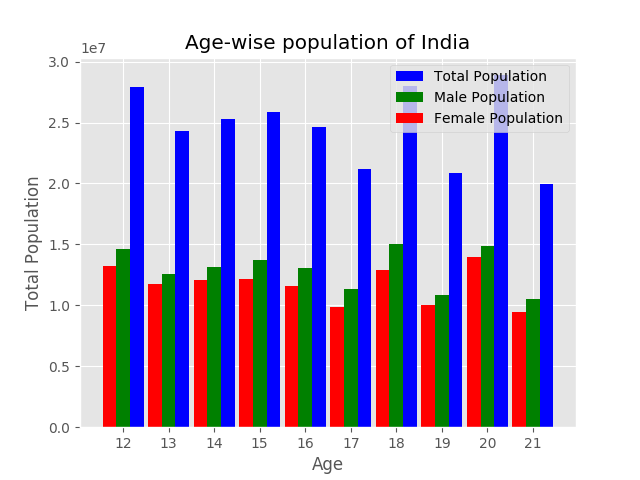
Matplotlib Tutorials in Python - Adding more Bar Charts to the Matplotlib Plot
We can simply add more than one Bar Chart in a Matplollib Plot by running plt.bar().
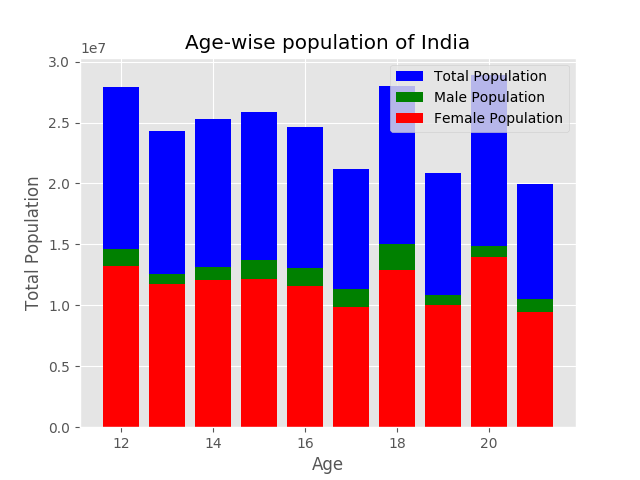
In the above plot, for each age range, female population < male population < total population, hence we can distinguish between the data but if the data is not linear like this, it won’t be possible to read the data from the plot that effectively.
Matplotlib Tutorials in Python - Stacking bars side-by-side in Matplotlib Bar Chart
To overcome the problem mentioned above, we will have to perform a little hack to place our Bars in the Matplotlib Charts side-by-side for better readability. For this we will be using numpy.Numpy will be installed automatically while installing matplotlib, if not, you can alternatively install it by:-
pip install numpy
Then, we will be adding following code to display the Bars side-by-side in the Matplotlib Bar Chart Plot:-
# matplotlib_barchart_tutorial.py

import numpy as np
age_indexes = np.arange(len(ages))
width = .30

plt.bar(age_indexes + width, total_population, width=width, color='b', label="Total Population")
plt.bar(age_indexes, male_population, width=width, color='g', label="Male Population")
plt.bar(age_indexes - width, female_population, width=width, color='r', label="Female Population")

plt.xticks(ticks=age_indexes, labels=ages)
Let me walk you through the code one by one:-
- We have imported the numpy as np.
- Then, we have created an array which has as many items as ages by using numpy.arange() and len() method to get the length of ages.
- Then we have defined the default width of each bar, this will be used to offset the bars to the left and right of the main bar chart.
- In plt.bar(), we have used +/- width to offset a particular bar to left and right of the male_population bar. Also, we have set the width = 0.30.
- Finally, to show x_indexes (i.e. from 0 to len of the list), we have set the labels of x-axis = ages.
Matplolib Tutorials in Python- Extracting data from CSV and plotting it as Matplotlib Bar Chart
In this section, we will parse data from a csv file using csv module and some other modules of python and then plot it as a Matplotlib Bar Chart using plt.bar() in matplotlib.
For this we will be using the data of services provided by various RPOs in India. I have downloaded the csv file from here and renamed it to ‘data.csv’.
We will be using the in-built csv module module to parse the data from the file. First of all let us have a look at what the data is:-
# matplotlib_barchart_tutorial.py

import csv
with open('../data/data.csv', 'r') as csv_file:
    csv_reader = csv.DictReader(csv_file)
    row = next(csv_reader)
    print(row)

# Output

OrderedDict([('ServiceName', 'Applications Received - Scheme wise'), ('RpoName', 'RPO Ahmedabad'), ('SchemeType', 'Normal'), ('LastWeekCount', '14196'), ('LastMonthCount', '68775'), ('YearTillDate', '447831'), ('Date', '2019-08-25 04:22:41.094411')])
We will be extracting the data by SchemeType and getting the numbers processed for that particular scheme from YearTillDate. Then we will be adding the said data for each RPO (RpoName). We will be creating an empty python dictionary called schemes_dict and add the keys and values using code.
# matplotlib_barchart_tutorial.py

schemes_dict = {}   #empty dictionary
with open('../data/data.csv', 'r') as csv_file:
    csv_reader = csv.DictReader(csv_file)
    for row in csv_reader:
        if row['SchemeType'] not in schemes_dict.keys():
            schemes_dict[row['SchemeType']] = int(row['YearTillDate'])
        else:
            schemes_dict[row['SchemeType']] += int(row['YearTillDate'])
This will give us the following dictionary.
# matplotlib_barchart_tutorial.py

print (schemes_dict)

# Output
{'Normal': 6839295, 'Tatkaal': 258603, 'FEMALE': 2586870, 'MALE': 4510888, 'TRANSGENDER': 249, 'Count of Applications': 7098007, '10TH PASS AND ABOVE': 2603471, '5TH PASS OR LESS': 33944, 'BETWEEN 6TH AND 9TH STANDARD': 38233, 'GRADUATE AND ABOVE': 2073126, 'Between_18_to_35': 3644579, 'Between_36_to_60': 1989386, 'GreaterThan60': 500636, 'LessThan18': 963406, 'Challan': 209902400, 'Credit/ Debit Card': 5000286450, 'Online': 3408535500, 'FRESH': 4519001, 'PCC': 333621, 'REISSUE': 2239541, 'No Verification': 931889, 'Post Verification': 1005761, 'Pre Verification': 4333366, 'More than 21 Days': 837586, 'Within 21 Days': 4210361}
Now, the values here has a very vast range, so we will sort the keys and values in descending order.
# matplotlib_barchart_tutorial.py

sorted_schemes = sorted(schemes_dict.items(), key=lambda kv: -kv[1])
print(sorted_schemes)

# Output

[('Credit/ Debit Card', 5000286450), ('Online', 3408535500), ('Challan', 209902400), ('Count of Applications', 7098007), ('Normal', 6839295), ('FRESH', 4519001), ('MALE', 4510888), ('Pre Verification', 4333366), ('Within 21 Days', 4210361), ('Between_18_to_35', 3644579), ('10TH PASS AND ABOVE', 2603471), ('FEMALE', 2586870), ('REISSUE', 2239541), ('GRADUATE AND ABOVE', 2073126), ('Between_36_to_60', 1989386), ('Post Verification', 1005761), ('LessThan18', 963406), ('No Verification', 931889), ('More than 21 Days', 837586), ('GreaterThan60', 500636), ('PCC', 333621), ('Tatkaal', 258603), ('BETWEEN 6TH AND 9TH STANDARD', 38233), ('5TH PASS OR LESS', 33944), ('TRANSGENDER', 249)]
Here we have used the sorted() function to sort the dict and have defined the key as the second item of dict (i.e. value) using a lambda function. The output here is a list of tuples with each tuple having scheme and total number. The first three/four values are way higher than the rest of them, so we will be taking 10 items starting from fifth item to get a good bar chart.
# matplotlib_barchart_tutorial.py

scheme = []
total_number = []
for item in sorted_schemes[4:14]:
    scheme.append(item[0])
    total_number.append(item[1])
So, here we have created two list of ten items each, the first one contains the scheme type and the other one contains the total number of applications processsed in the said scheme. Now we will be plotting this data.
# matplotlib_barchart_tutorial.py

import matplotlib.pyplot as plt
import csv

schemes_dict = {}
with open('../data/data.csv', 'r') as csv_file:
    csv_reader = csv.DictReader(csv_file)
    for row in csv_reader:
        if row['SchemeType'] not in schemes_dict.keys():
            schemes_dict[row['SchemeType']] = int(row['YearTillDate'])
        else:
            schemes_dict[row['SchemeType']] += int(row['YearTillDate'])
sorted_schemes = sorted(schemes_dict.items(), key=lambda kv: -kv[1])

scheme = []
total_number = []
for item in sorted_schemes[3:13]:
    scheme.append(item[0])
    total_number.append(item[1])

plt.bar(scheme, total_number)
plt.xlabel("Scheme")
plt.ylabel("Total Applications")
plt.title("Scheme-wise Passport Applications processed in India")
plt.show()
We will get the following Matplotlib plot:-
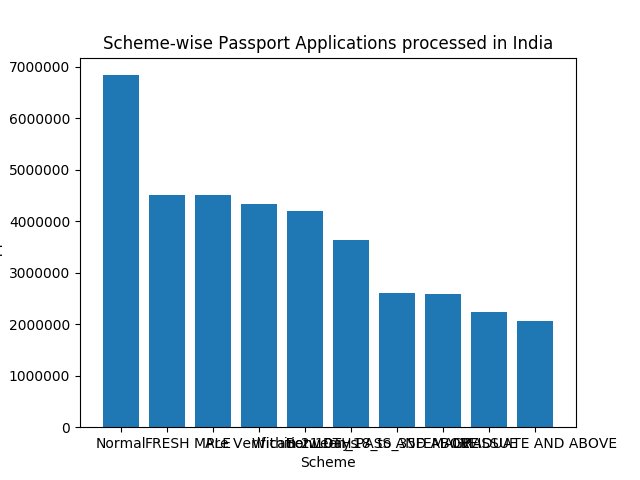
Here, the x-labels are not legible, Let us change it. We will be using rotation method in plt.xticks() to rotate it vertically i.e. 90 degrees (You can rotate it to any angle, play around). Then we will be using plt.subplots_adjust(), to adjust the plot by setting left and bottom margin.
# matplotlib_barchart_tutorial.py
plt.xticks(rotation=90)
plt.subplots_adjust(left=.15, bottom=.4)
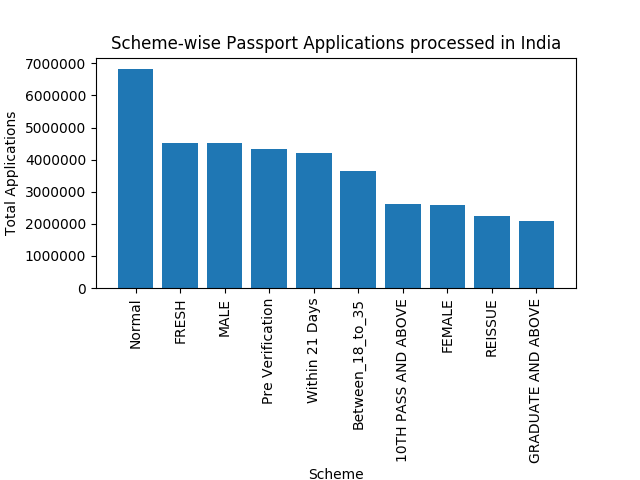
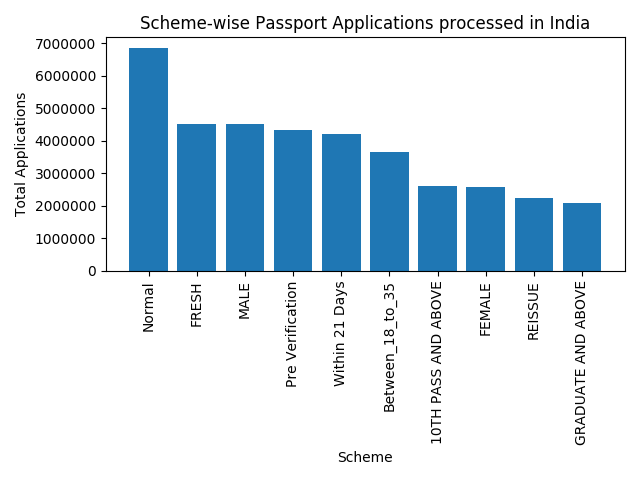
Let us use plt.tight_layout() to make it better:-
# matplotlib_barchart_tutorial.py

plt.tight_layout()
plt.show()
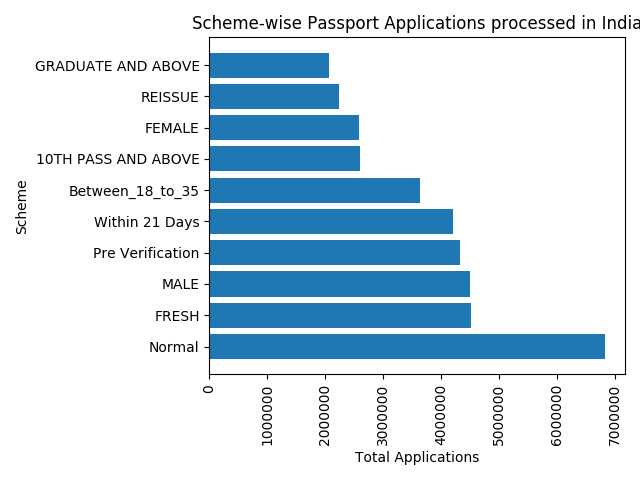
Creating horizontal barchart in Matplotlib
Creating a horizontal bar chart is as easy as using plt.barh() instead of plt.bar() and tweaking a bit with plt.xlabel() and plt.ylabel().
# matplotlib_barchart_tutorial.py

plt.barh(scheme, total_number)
plt.xlabel("Total Applications")
plt.ylabel("Scheme")
plt.title("Scheme-wise Passport Applications processed in India")
plt.xticks(rotation=90)
plt.subplots_adjust(left=.15, bottom=.4)
plt.tight_layout()
plt.show()
If you have liked our tutorial, there are various ways to support us, the easiest is to share this post. You can also follow us on facebook, twitter and youtube.
In case of any query, you can leave the comment below.
In the next chapter we will learn about drawing Pi-charts in Matplotlib in Python.
Video Tutorial
Table of Contents of Matplotlib Tutorials for Python
Matplotlib Tutorial in Python | Chapter 1 | Introduction
Matplotlib Tutorial in Python | Chapter 2 | Extracting Data from CSVs and plotting Bar Charts
Pie Charts in Python | Matplotlib Tutorial in Python | Chapter 3
Matplotlib Stack Plots/Bars | Matplotlib Tutorial in Python | Chapter 4
Filling Area on Line Plots | Matplotlib Tutorial in Python | Chapter 5
Python Histograms | Matplotlib Tutorial in Python | Chapter 6
Scatter Plotting in Python | Matplotlib Tutorial | Chapter 7
Plot Time Series in Python | Matplotlib Tutorial | Chapter 8
Python Realtime Plotting | Matplotlib Tutorial | Chapter 9
Matplotlib Subplot in Python | Matplotlib Tutorial | Chapter 10
Python Candlestick Chart | Matplotlib Tutorial | Chapter 11
If you have liked our tutorial, there are various ways to support us, the easiest is to share this post. You can also follow us on facebook, twitter and youtube.
In case of any query, you can leave the comment below.
If you want to support our work. You can do it using Patreon.