Matplotlib Subplot in Python | Chapter 10
In this Matplotlib Subplot tutorial, we will be learning to create Matplotlib Subplots. Till now, we have been using matplotlib.pyplot() to create the plots. But now, we will be using matplotlib.pyplot.subplots() (ptl.subplots()) to create Matplotlib Subplots.
Matplotlib.pyplot() or plt was automatically creating the plot which had one figure and one grid. But using Matplotlib subplots, we can create mutliple figures and grids. So, let us get started.
Decoding Matplotlib.pyplot.subplots()
matplotlib.pyplot.subplots() or plt.subplots() returns:-
(i) fig : A Figure is the window which is returned on calling plt.show(). It is the window which holds the graph/grid/axes.
(ii) ax : ax can be either a single Axes object or an array of Axes objects if more than one subplot was created.
Let us create an new file ‘matplotlib_subplot_python.py’
# matplotlib_subplot_python.py

import matplotlib.pyplot as plt

fig, ax = plt.subplots()

print(fig)
print(ax)

# output

Figure(640x480)
AxesSubplot(0.125,0.11;0.775x0.77)
plt.subplot() takes nrows and ncols as argument, which are 1 as default, hence just calling plt.subplots() has returned one figure and one axes. Let us change it and see our output.
# matplotlib_subplot_python.py

fig, ax = plt.subplots(nrows=1, ncols=2)

# output

Figure(640x480)
[<matplotlib.axes._subplots.AxesSubplot object at 0x1089bc358>
 <matplotlib.axes._subplots.AxesSubplot object at 0x10f675630>]
Here ax is an array of two axes objects. The following examples will make it more clear.
Create Matplotlib Subplot with one figure and one axes
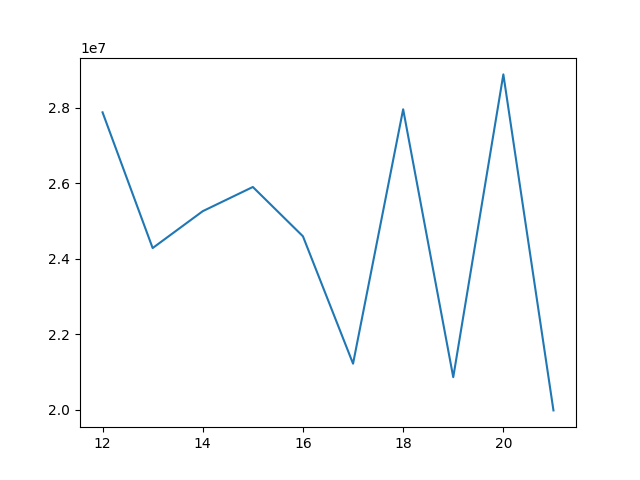
We will create a Matplotlib Subplot for the population data as done in Chapter 1, but instead of using plt.plot() directly, we will be creating a subplot and then plotting the data.
# matplotlib_subplot_python.py

import matplotlib.pyplot as plt

ages = [12, 13, 14, 15, 16, 17, 18, 19, 20, 21]

total_population = [27877307, 24280683, 25258169, 25899454, 24592293, 21217467, 27958147, 20859088, 28882735, 19978972]

fig, ax = plt.subplots()

ax.plot(ages, total_population)

plt.show()
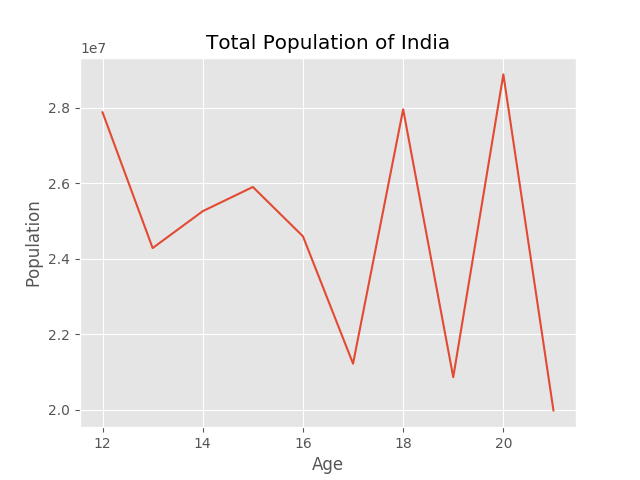
Unlike plt.plot, we have to ax.set_title(), ax.set_xlabel() and ax.set_ylabel().
# matplotlib_subplot_python.py

plt.style.use('ggplot')

ax.set_title('Total Population of India')
ax.set_xlabel('Age')
ax.set_ylabel('Population')
ax.plot(ages, total_population)

plt.show()
Create Matplotlib Subplot with one figure and two axes
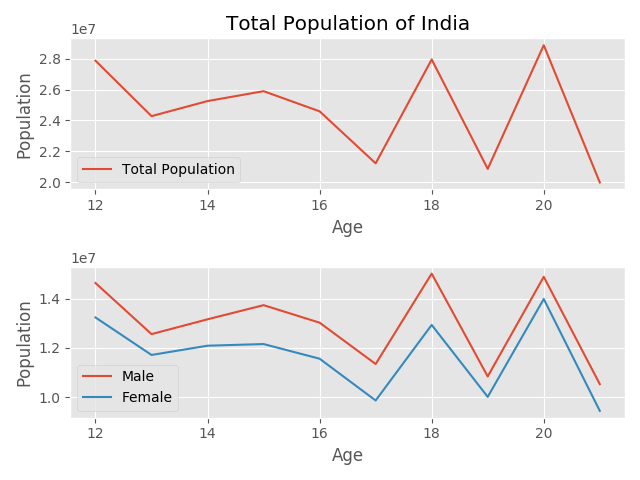
Let us create two Matplotlib subplots stacked vertically, we will be using population data for men and women for one Matplotlib Subplot and total population for other subplot.
# matplotlib_subplot_python.py

import matplotlib.pyplot as plt

plt.style.use('ggplot')

ages = [12, 13, 14, 15, 16, 17, 18, 19, 20, 21]

total_population = [27877307, 24280683, 25258169, 25899454, 24592293, 21217467, 27958147, 20859088, 28882735, 19978972]

# Male Population
male_population = [14637892, 12563775, 13165128, 13739746, 13027935, 11349449, 15020851, 10844415, 14892165, 10532278]

# Female Population
female_population = [13239415, 11716908, 12093041, 12159708, 11564358, 9868018, 12937296, 10014673, 13990570, 9446694]

fig, (ax1, ax2) = plt.subplots(nrows=2, ncols=1)

ax1.set_title('Total Population of India')
ax1.set_xlabel('Age')
ax1.set_ylabel('Population')
ax1.plot(ages, total_population, label='Total Population')

ax2.plot(ages, male_population, label='Male')
ax2.plot(ages, female_population, label='Female')
ax2.set_xlabel('Age')
ax2.set_ylabel('Population')

ax1.legend()
ax2.legend()
plt.tight_layout()
plt.show()
Sharing Axes of Matplotlib Subplots
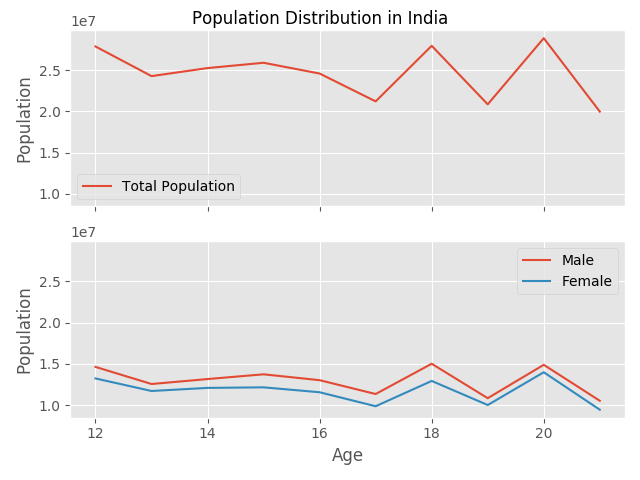
In Matplotlib Subplots, each axes is scaled individually by default.Therefore, if the tick values have different range, the matplotlib subplots do not align. To overcome this problem, we can share both x-axes and y-axes as under. Also, we do not need x_label for both the matplotlib subplots. Also, we can set one title for the whole figure, using fig.suptitle().
# matplotlib_subplot_python.py

fig, (ax1, ax2) = plt.subplots(nrows=2, ncols=1, sharex=True, sharey=True)

fig.suptitle('Population Distribution in India')
ax1.plot(ages, total_population, label='Total Population')
ax1.set_ylabel('Population')

ax2.plot(ages, male_population, label='Male')
ax2.plot(ages, female_population, label='Female')
ax2.set_xlabel('Age')
ax2.set_ylabel('Population')

ax1.legend()
ax2.legend()
plt.tight_layout()
plt.show()
Stacking Matplotlib Subplots Horizontally
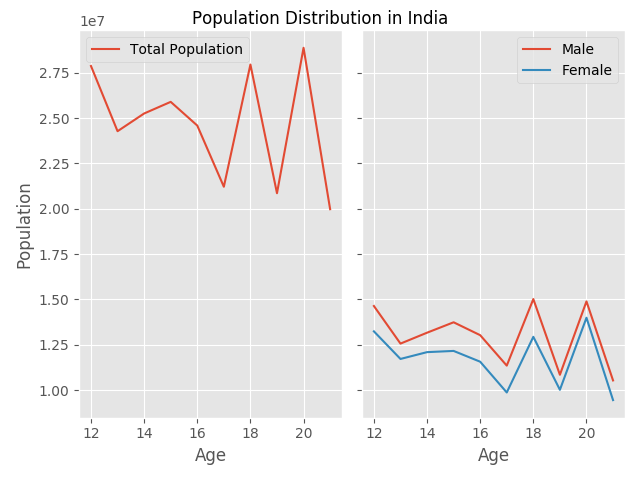
Instead of stacking the Matplotlib plots vertically, we can stack them horizontally also.
# matplotlib_subplot_python.py

fig, (ax1, ax2) = plt.subplots(nrows=1, ncols=2, sharex=True, sharey=True)
Matplotlib Subplots with more than 2 axes
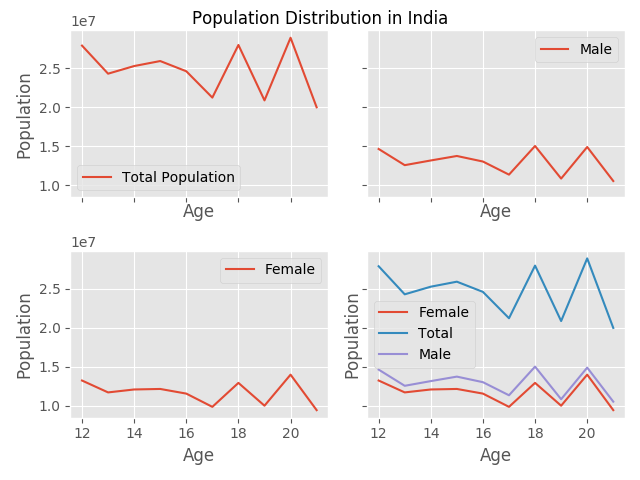
We can also create Matplotlib Subplots with more than two axes using the following code:-
# matplotlib_subplot_python.py

import matplotlib.pyplot as plt

plt.style.use('ggplot')

ages = [12, 13, 14, 15, 16, 17, 18, 19, 20, 21]

total_population = [27877307, 24280683, 25258169, 25899454, 24592293, 21217467, 27958147, 20859088, 28882735, 19978972]

# Male Population
male_population = [14637892, 12563775, 13165128, 13739746, 13027935, 11349449, 15020851, 10844415, 14892165, 10532278]

# Female Population
female_population = [13239415, 11716908, 12093041, 12159708, 11564358, 9868018, 12937296, 10014673, 13990570, 9446694]

fig, ((ax1, ax2), (ax3, ax4)) = plt.subplots(nrows=2, ncols=2, sharex=True, sharey=True)

fig.suptitle('Population Distribution in India')

ax1.plot(ages, total_population, label='Total Population')
ax1.set_ylabel('Population')
ax1.set_xlabel('Age')

ax2.plot(ages, male_population, label='Male')
ax2.set_xlabel('Age')
# ax2.set_ylabel('Population')
ax3.plot(ages, female_population, label='Female')
ax3.set_ylabel('Population')
ax3.set_xlabel('Age')

ax4.plot(ages, female_population, label='Female')
ax4.plot(ages, total_population, label='Total')
ax4.plot(ages, male_population, label='Male')
ax4.set_ylabel('Population')
ax4.set_xlabel('Age')

ax1.legend()
ax2.legend()
ax3.legend()
ax4.legend()
plt.tight_layout()
plt.show()
Matplotlib Subplot with more than one figure
You can also create more than one figure for your code. This is helpful in the case you are running a background script and saving the figures. Instead of calling plt.show() mutliple times, you can have more than one figures with the help of Matplotlib subplots and save it using savefig().
# matplotlib_subplot_python.py

import matplotlib.pyplot as plt

plt.style.use('ggplot')

ages = [12, 13, 14, 15, 16, 17, 18, 19, 20, 21]

total_population = [27877307, 24280683, 25258169, 25899454, 24592293, 21217467, 27958147, 20859088, 28882735, 19978972]

# Male Population
male_population = [14637892, 12563775, 13165128, 13739746, 13027935, 11349449, 15020851, 10844415, 14892165, 10532278]

# Female Population
female_population = [13239415, 11716908, 12093041, 12159708, 11564358, 9868018, 12937296, 10014673, 13990570, 9446694]

fig, ((ax1, ax2), (ax3, ax4)) = plt.subplots(nrows=2, ncols=2, sharex=True, sharey=True)

fig1, ax1 = plt.subplots()
fig2, ax2 = plt.subplots()

ax1.set_label('Total Population of India')
ax1.plot(ages, total_population, label='Total Population')
ax1.set_ylabel('Population')
ax1.set_xlabel('Age')

ax2.set_label('Male Population of India')
ax2.plot(ages, male_population, label='Male Population Population')
ax2.set_ylabel('Population')
ax2.set_xlabel('Age')

ax1.legend()
ax2.legend()

fig1.savefig('fig1')
fig2.savefig('fig2')
Matplotlib Video Tutorial Series
We are glad to inform you that we are coming up with the Video Tutorial Series of Matplotlib on Youtube. Check it out below.
Matplotlib Tutorial in Python | Chapter 1 | Introduction
Matplotlib Tutorial in Python | Chapter 2 | Extracting Data from CSVs and plotting Bar Charts
Pie Charts in Python | Matplotlib Tutorial in Python | Chapter 3
Matplotlib Stack Plots/Bars | Matplotlib Tutorial in Python | Chapter 4
Filling Area on Line Plots | Matplotlib Tutorial in Python | Chapter 5
Python Histograms | Matplotlib Tutorial in Python | Chapter 6
Scatter Plotting in Python | Matplotlib Tutorial | Chapter 7
Plot Time Series in Python | Matplotlib Tutorial | Chapter 8
Python Realtime Plotting | Matplotlib Tutorial | Chapter 9
Matplotlib Subplot in Python | Matplotlib Tutorial | Chapter 10
Python Candlestick Chart | Matplotlib Tutorial | Chapter 11
If you have liked our tutorial, there are various ways to support us, the easiest is to share this post. You can also follow us on facebook, twitter and youtube.
In case of any query, you can leave the comment below.
If you want to support our work. You can do it using Patreon.

